Python for Data Analysis: A Book Review
December 19th, 2018
For the last couple days while not networking or applying for jobs I’ve been parked in a couple of cafes in Shanghai working my way through the book “Python for Data Analysis“. After finishing the book I of course updated my resume, LinkedIn, and the rest of social media because I need a new job, apparently passing the third and final CFA® Exam wasn’t enough for any employer I’ve applied to and I’ve applied to many, many, job postings since I finished my MBA.
Why Python?
I was asked “Why Python?” having already programmed in a half a dozen other languages. I told the fellow I got tired of seeing it in job postings. It is supposedly the third most popular programming languages and I’ve already learned how to program in the most popular pair, but he wanted to know what advantages it had over say Java or Objective-C. Now first of all I think I prefer either Java or Objective-C because I was trained to be an OOP purist and I prefer strongly typed languages rather than assigning random data to random variables willynilly. I like the structure, the planning of classes, models and views, plus the consistency of naming in the methods, functions, and variables found in Java and Objective-C. But thinking back to last time I programmed in either language there is definite overhead to using both, more so with Objective-C.
Python is FREE
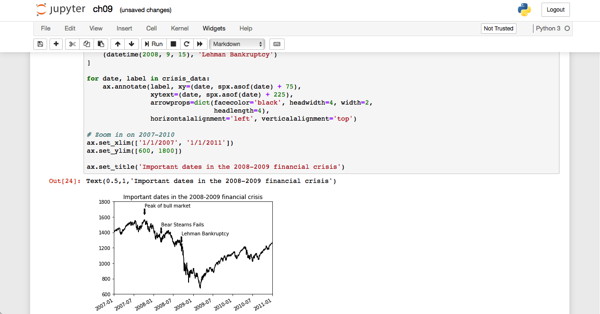
I learned to program both on old PCs and on various flavours of *Nix so I am used to the command line, but nowadays if you write Java you’re likely using Eclipse or some other IDE. For Objective-C there is even more overhead. You can use gcc to compile Objective-C and you can mix in both C and C++ in your project, but in order to use the Foundation and many other libraries you need a modern Mac and Xcode. That costs real money and if you want to deploy your code you must pay even more. Python is open source and runs on the three major modern computing platforms, you can get started for free and use any text editor you like. I used BBEdit but much of the Python you type goes directly into the interpreter or iPython or you can follow along in Jupyter Notebook which is how Wes McKinney designed his book, particularly the visualization chapter.

Python is Interactive
The interactive aspect of Python is probably a boon for teaching computer science fundamentals and people who just want to “make it go”. They don’t want to create a new project in ProjectBuilder err Xcode. You do still have to update libraries in Python, but the tool Wes would recommend for that are conda and pip, which worked well for the most part. But you must use the command line, so if you want nothing to do with the command line, Python may not be for you.
Data Analysis using pandas
Python can load a lot of data into memory into pandas which is a framework created by Wes for data analysis. You can load data from a variety of sources including many popular file formats but also databases or APIs. If you know SQL or regex you can leverage that knowledge. Python seems particularly strong for analyzing time series but can also be used to analyze autoregressive models or to do ANOVA style statistical analysis. These are all part of the quantitative analysis portion of the CFA Program curriculum.
Isn’t Excel Enough?
Previously if I were to do a liner regression I would use Excel or be forced to use a BAII Plus calculator. You can extend Excel a lot using VBA something I studied after completing my MBA. But there are limits to Excel, so for those working with extremely large datasets or those who want to use advanced algorithms or automation or for those for whom open source means more than free, Python has often become the tool of choice. Python err pandas even has Pivot Tables if you think those are the bee’s knees.
Sharpening the Saw
I plan to do something with my new Python data analysis skills, maybe even dust off my Excel skills and show how to do analysis with either tool. I doubt I’ll dig deeper into machine learning at this time. Instead I will be focussing more on visualization including learning Tableau as it too is always in job postings I look at. I was trying to think of some data I have lying around on my laptop I could analyze. I thought about doing something with fantasy hockey projections and their deviation from reality, but I wanted a time series so I might just use one of the Excel spreadsheets I’ve given away to generate one or perhaps download some real world data from Yahoo Finance.
Python = $$$ right?
My number one priority however, is finding a new job and I think my time is just about up in China. I’ve been here almost four years and again despite passing all three CFA Exams and other certification exams on top of that, I could not earn a promotion or a transfer or find another job that wasn’t teaching English, and no one can say I haven’t networked lately. I don’t think Python is necessarily the answer, nor is Tableau, somethings just can’t be overcome…
Python and Data Analysis Resources
This blog post is already probably too long and unfocussed. I will update it as I continue my study of data analysis with Python. Wes suggested some additional resources and I’ll add to this list as I solve real world problems. I’ll probably write one more blog post before the end of the year, but my hopes for 2019 are greatly diminished. It seems like 2019 will start the way 2006 did with me moving back to Canada to be unemployed.
- Resources from my previous post on Learning Python
- Why use Python?
- Pythonic Data Cleaning With NumPy and Pandas
- Simple Yet Powerful Excel Tricks for Analyzing Data
- Tableau Python Forecasting
- Time Series for Dummies – The 3 Step Process
- The 10 Statistical Techniques Data Scientists Need to Master
- 5 Big Data And Analytics Learning Resources That Most People Miss (But Shouldn’t)
What of Big Data & Infographics?
I’ve already acquired the next book and probably two books I will read about analysis and visualization. I bought the Humble Bundle for Big Data & Infographics which helped raise money for Doctor’s without Borders if that makes it better. I prefer real books, just getting the eBook I wanted to read next onto my iPad was a chore, it used to be you put them into iTunes but now they go in iBooks. I also bought two new actual paper books “Blue Ocean Strategy” and “Slaughterhouse Five”. However, my biggest priority is finding a new job so I’ve been applying to my list of companies that hire a large number of CFA Charterholders again. I am willing to relocate and may have to as my contract and visa expire in January. You can of course view my resume.
In 2025, I returned to studying Python. I actually started my just completed certificate in Data Science for Investment Professionals in 2024. Of course I have done some Python since 2018, but not as much as I expected given all the hype on the Internet back in the day. Now the hype is all AI all the time. So I will take yet another course and this one may have an even greater focus on using Python for machine learning and natural language processing than the one I just completed. If you have any thoughts on Python or data analysis you can still leave a comment below.
This entry was originaly posted on , it was last edited on and is filed under: Reviews and tagged: Book Review, Data Analysis, Python.

