
Microsoft Office Upgrade
July 21st, 2011
After yesterday’s furious update of Mac OS X Lion and a whole bunch of apps, I finally got around to trying my new version of Microsoft Word and Microsoft Excel this morning. Microsoft Word templates gave me some grief, Mac OS X Lion doesn’t even want me to see my Library folder now, I had to trick Finder into going to it. Then one of my document templates, basically the biggest most elaborate one seems to crash Microsoft Word.
Onward to Excel…
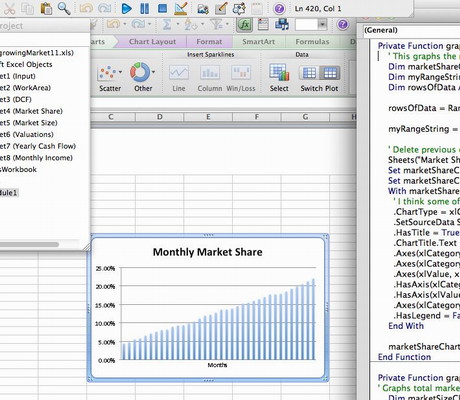
The spreadsheets I was working on most recently worked. In fact Excel seemed to be working solidly. Even the first spreadsheet with VBA that I tried, created during my first period of post-MBA unemployment worked well enough, the second one I tried, not so well. Two of the charts I was generating with VBA no longer seem to generate. No errors were thrown, just blank worksheets. I had to fire up Microsoft’s VBA editor for the first time in a long time, and I had forgotten how much I dislike VBA syntax. Maybe some kind soul can quickly spot what is wrong. It appears I followed some advice on using the Macro Recorder to record the VBA needed to create the exact chart I wanted. I vaguely remember doing this from 2006.
Here are the two methods that should draw the charts, all my calculations seem to be working though I haven’t tried every permutation. This was an elaborate spreadsheet with a lot of VBA. I spent weeks working on it, I’m not looking forward to having to fix it.
Private Function graphMarketShare()

' This graphs the monthy market share as a percentage

Dim marketShareChart As Chart

Dim myRangeString As String

Dim rowsOfData As IntegerrowsOfData = Range("Rows_In_WorkArea").ValuemyRangeString = "E2" & ":" & "E" & (rowsOfData + 1)' Delete previous chart

Sheets("Market Share").ChartObjects.Delete

Set marketShareChart = Charts.Add

Set marketShareChart = marketShareChart.Location(Where:=xlLocationAsObject, Name:="Market Share")

With marketShareChart

' I think some of this stuff is redundent but the macro recorder did it and the output looks fine

.ChartType = xlColumnClustered

.SetSourceData Source:=Sheets("WorkArea").Range(myRangeString), PlotBy:=xlColumns

.HasTitle = True

.ChartTitle.Text = "Monthly Market Share"

.Axes(xlCategory, xlPrimary).HasTitle = True

.Axes(xlCategory, xlPrimary).AxisTitle.Characters.Text = "Months"

.Axes(xlValue, xlPrimary).HasTitle = False

.HasAxis(xlCategory, xlPrimary) = False

.HasAxis(xlValue, xlPrimary) = True

.Axes(xlCategory, xlPrimary).CategoryType = xlAutomatic

.HasLegend = False ' only graphing one thing so no need for a legend

End WithmarketShareChart.SeriesCollection(1).Name = "=""Market Share"""

End Function
I made a lot of methods like this over time and the ones I checked in the first spreadsheet alphabetically seemed to work, even one or two charts are successfully created in this spreadsheet. I fear I shall have to re-learn VBA syntax and how to debug it all over again. Here is the other chart that isn’t being created:
Private Function graphMarketSize()

' Graphs total market size

Dim marketSizeChart As Chart

Dim myRangeString As String

Dim rowsOfData As IntegerrowsOfData = Range("Rows_In_WorkArea").ValuemyRangeString = "D2" & ":" & "D" & (rowsOfData + 1)Sheets("Market Size").ChartObjects.Delete

Set marketSizeChart = Charts.Add

Set marketSizeChart = marketSizeChart.Location(Where:=xlLocationAsObject, Name:="Market Size")

With marketSizeChart

.ChartType = xlLine

.SetSourceData Source:=Sheets("WorkArea").Range(myRangeString), PlotBy:=xlColumns

.SeriesCollection(1).Name = "=""Market Size"""

.HasLegend = False ' only graphing one thing so no need for a legend

.HasTitle = True

.ChartTitle.Text = "Market Size"

.HasAxis(xlCategory, xlPrimary) = False

.HasAxis(xlValue, xlPrimary) = True

.Axes(xlCategory, xlPrimary).HasTitle = True

.Axes(xlCategory, xlPrimary).AxisTitle.Characters.Text = "Months"

.Axes(xlCategory, xlPrimary).CategoryType = xlAutomatic

End With

End Function
That is enough VBA for this morning. I still have PHP to debug. For the record I can’t think of two languages I dislike more than I’ve been forced to work with due to their popularity than VBA and PHP.
Debugging VBA
Just for fun I ran the first method in the debugger, as Microsoft VBA slowly comes back to me. It worked! I took a screen shot of the graph it created and everything. Now why wouldn’t it worked when called as part of the entire process?
Sometimes problems solve themselves
All seems to be well in Microsoft Excel/VBA land after all. Maybe I missed something all those years ago, but it appears the code is working, it just needed time to warm up.
Another thing I’ve been doing is updating the document type on these spreadsheets, at least the local development copy on my hard drive. They now have to be .xlsm which is Microsoft Excel’s XML based file format that supports VBA and macros. Apparently only a small minority of people care enough about Excel to use VBA & macros so now we have our own special file format. The copies on my webserver, those linked to way above for instance are still .xls formatted documents. Let me know if they don’t work and you’d like them replaced with .xlsm documents.
More Excel Observations
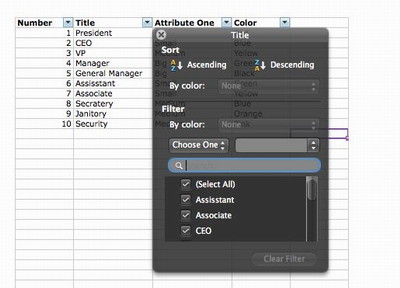
I use a lot more of the features of Excel perhaps than I do of Word on a regular basis, or I’ve just been forced to in ensuring that the Excel files I made available online still work. I keep loading old Excel files and discovering that a lot of stuff has changed in seven years, at least graphically. At some point for myself or someone else I made an Excel spreadsheet to demonstrate “filtering”. Here is a screen shot from that spreadsheet in Microsoft Office 2011.
It also should be noted that in most cases when I open one of my old Excel files especially a more elaborate one I get a warning saying “Data May Be Lost”, hence why I’ve been checking many different Excel documents that I spent many, many hours creating and editing over the years. Here is a pretty graph I made as part of my MBA Internship at Noratek:
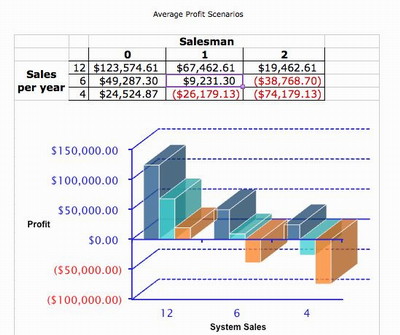
Maybe if I just keep posting screenshots of fancy Excel spreadsheets I made in a past life someone will notice and offer me a job. If you have any other career or Excel advice you can leave it below.
This entry was originaly posted on , it was last edited on and is filed under: Technology and tagged: Apple, Mac OS X Lion, Microsoft Excel, Microsoft Office.


For seven years my spreadsheets worked. Now after upgrading to Mac OS X Lion, solutions to problems I already solved require a lot of work just to get things to work as well as they did a few years ago. WTF? This is not progress. Mac OS X Lion and Microsoft Office 2011 are not making my life better, they are just making me relearn how to do stuff I already knew how to do and often I can’t get things to work as well as they used to.
Just downloaded a new version of solver.
http://www.solver.com/mac/dwnmac2011solver.htm
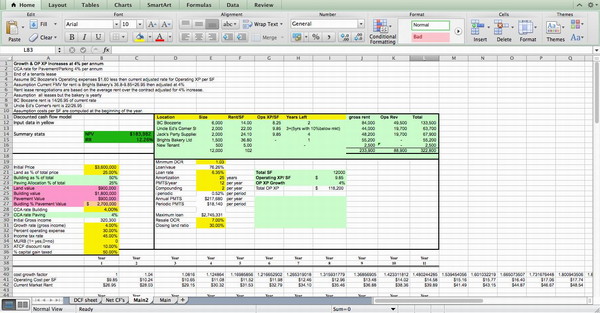
Trying to get spreadsheets that used to work fine in Microsoft Office 2004 to work again in Microsoft Office 2011 as people are up in arms about social house in the DTES and I built a spreadsheet that does a bunch of real estate calculations for various mixes of social and commercial land use a few years back… Damn Mac OS X Lion upgrade and just plain entropy as I don’t remember much VBA and these spreadsheets use VBA in addition to solver…