
Excel Spreadsheet for planning a new business
July 23rd, 2012
After my recent post about spreadsheets I’ve given away online, I got asked if I ever made a general new business planning Excel spreadsheet. I said “not exactly” and gave some excuses why ultimately you need to build a custom spreadsheet as every business is just a little bit different and has different drivers and models, but I have built spreadsheets that do quick estimates and projections, so extending those or combining those or using one of those as a basis might be possible.
Other people have attempted this and the biggest problem is including just the right amount of detail. Some spreadsheets are too big and complicated and only the person who made it can explain how it works. Other examples you find online or in a book are too simplistic and don’t provide all the answers to your questions, or the questions being asked by potential investors. I tried to strike a balance having done many financial projections and having passed all three CFA® exam and most importantly having had to explain my projections to people of varying levels of financial sophistication and from different backgrounds. I still have a few ideas to improve it further, but I think the bugs are all worked out so I decided to let some more people poke at it.
It should go without saying if you download a Microsoft Excel file from my website, upload it to another website and claim it as your own work, I will find out, and I will take action.
One of the biggest shortcomings of spreadsheets you download online is lack of instructions or explanations on how they work. Before I entered a single number, I thought about what data I wanted to present, how many tabs I would need, and I wrote instructions on how the spreadsheet works. As I constructed the spreadsheet I updated and improved the instructions in the hopes that people wouldn’t need to look at formulas inside of cells. Those that want to dig deeper or modify the spreadsheet, of course have that option. I ask that you not take credit for my original work, nor resell it commercially. It is intended to help first time entrepreneurs, not people who rip off bloggers.
Instructions
This spreadsheet allows for the quick creation of financial projections and financial statements when planning a entrepreneurial venture. It is designed to be as general as possible but may not prove suitable for all businesses, particularly those with complicated financial structures or irregular revenue. The spreadsheet assumes you buy all equipment needed. The spreadsheet defaults to 100% debt financing, a mix of debt and equity financing is also possible. No depreciation or amortization expenses are calculated and a simple flat tax rate is assumed, with funds for taxes being set aside as taxable income is earned.
- Fill out the Questionnaire tab. All boxes in light blue should be filled out first. I recommend you raise slightly more capital than you need. Next complete the financing and sales estimate section. Do not forget to include the tax rate.
- Next I recommend you select “Save as…” from the File menu and make a copy of this spreadsheet. I recommend you modify the copy not the original.
- Unless you are confident in your Excel skills and business planning expertise I recommend you skip the Master Control tab. If you must meddle, adjust the orange cells only.
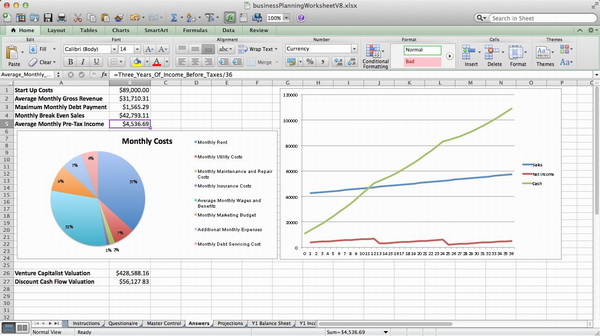
- The Answers tab contains the most useful information when planning a business including estimates of: startup costs, monthly debt payment, revenue, break even sales, and average monthly pre-tax income.
- The Projections tab contains revenue, income, and cost projections for three years. Do not modify this tab unless you know what you’re doing.
- The Balance Sheet is prepared in accordance with IFRS.
- The Income Statement is prepared in accordance with IFRS.
- The Statement of Cash Flow is prepared in accordance with IFRS.
- The Valuation tab attempts to value the proposed business using the venture capital method and the discounted cash flow method.
- Y1 Bookkeeping tab is used to double check math and presents data in a slightly different manner, than previous tabs.
 What about?
I gave a lot of thought as to what to include but also what to leave out when building this spreadsheet and previously when building similar spreadsheets for the So You Want To Open A Brew Pub series of blog posts. This spreadsheet goes further as it produces three years of projections as well as a hopefully passable: Balance Sheet, Income Statement, and Statement of Cash Flows. I tried to follow IFRS standards, but I’m not an accountant. However by taking the time to estimate your business’ costs and filling in 28 cells on the Questionnaire tab you should get some useful numbers and information. I did anticipate certain questions so I will attempt to answer them:
- Why IFRS? Well I’m not American, but in reality for most startups in their first fiscal year they are unlikely to go public or engage in any accounting shenanigans. It should be easy to covert to U.S. GAAP or change to a different currency symbol. I didn’t spend a lot of time on cosmetics.
- Taxes are assumed to be a simple flat tax rate. Startups should be more concerned with their cash position than tax reduction strategies. My projections focus on pre-tax income, but I also decided to deduct tax as a cash expenses as taxable income is earned. This is considered conservative.
- Depreciation and Amortization I deliberately left out. Not every startup buys a lot of equipment. Not all equipment is depreciated at the same rate. Estimating useful life and salvage value isn’t for beginners. Both are non-cash expenses, it is just simpler to leave out.
- Equipment Leasing is very common in many businesses across many industries. Unfortunately it is more difficult to account for than simply purchasing equipment. Leasing from multiple vendors likely means dealing with different terms and rates. The easiest way to include leasing costs is to lump them in as miscellaneous monthly expenses, but to do it correctly would require modifying more than just a single tab or cell.
- Seasonal Revenue is also very common and something I’ve had to account for in many business plans. Modifying row 4 in the Projections tab can easily model seasonal sales. Everything else should still just work.
- Exponential Growth is what many business plans predict, but isn’t that common. This spreadsheet has a simple month over month linear growth model. Modifying row 4 of the Projections tab or each monthly sales figure will produce a hockey stick shaped graph with a certain amount of trial and error.
- Inventory, Accounts Receivable, Accounts Payable are assumed to be perfectly managed, every order filled and paid for with cash immediately. This is of course unrealistic but it is the easiest to model and explain.
Additional Resources
- Startup Financial Model complete with Excel spreadsheet, definitely aimed at IT startups seeking venture capital.
- Various articles and advice from Michael Volker.
- Taylor Davidson sells spreadsheets for entrepreneurs and teaches courses in financial modeling.
- Analyzing Financial Statements by Fred Wilson.
- A collection of links and advice on building financial models for startups.
In August of 2019 this post started getting 68% of all my spam comments, so if you really want to leave a comment you’ll have to use email or social media as I’m closing comments now.
This entry was originaly posted on , it was last edited on and is filed under: Technology and tagged: Entrepreneurship, Microsoft Excel, Spreadsheet.


Many Thanks for your work..I mean these file….
great work… thank you.
I’m glad you found it useful.
Very helpful indeed, thank you!
Hi Andrew. I recently found your site and have downloaded your Business Planning Worksheet and Venture Capital Calculation worksheet to help construct my financials for a new business and discussing terms with funding sources. Thank you for the very helpful tools. I am a little rusty with my finance, so while I’m trying to use the two together, I have a few questions if you would be so kind to help me with:
1a. In the DCF method, the ‘Residual’ is the discounted (by equity target) perpetuity value, where perpetuity value = the annuity value (net income for the last year of projections) / interest rate, is this correct?
1b. This leaves me confused about the use of the Capitalization Rate in the ‘Residual’ equation. I’ve researched it a bit and it appears to be typically used as something similar to rental yield, mostly applicable to real estate. Isn’t cost of capital or equity hurdle rate typically used, or is this purely a preference?
2. In the Venture Capitalization Valuation Method, is the ‘Percentage of Market Captured’ only relevant to the projection period, or does this extend further out?
Thanks again for the tools and advice.
These are a lot harder questions than the spreadsheet won’t download and how I don’t know how to change tabs…
Your questions are also both to do with a Spreadsheet not downloadable directly from this blog post that I made on Friday November 17th 2006, that is practically an eternity ago in the blogosphere.
Residual value is the lump sum value of all future earnings. The DCF worksheet uses the PV formula built into Excel and discounts earnings back one year at a time. Then at the end in my macro/VBA code I do this:
residualValue = (netIncome / capitalizationRate) / Application.WorksheetFunction.Power((1 + rate), exitYear)
netIncome is defined as:
marketSize * growthRate * (1 – operatingMargin)
So residual value is an estimate of future Net Income based on market size, growth rate, and operating margin, divided by the capitalization rate then the whole thing is discounted back. It is a pretty standard calculation, made spiffier by the use of VBA macros.
Using capitalization rate may have been a bit of laziness or it may just be that certain terms are used interchangeably. You need a cost of capital or a discount rate number, I wanted it do be different from the desired IRR number, perhaps I chose the wrong term. Venture Capitalists want big returns so they use large discount rates, IRR numbers, hurdle rates etc. Sometimes the jargon gets overwhelming especially if you’ve been away from it for a while, such as 7 years since I made this spreadsheet.
Perhaps I should have chosen hurdle rate as my label instead of capitalization rate, but according to the Wikipedia I think I used the right term and the right calculation:
https://en.wikipedia.org/wiki/Capitalization_rate#Use_for_valuation
There pretty good spreadsheets, if people are still using them 7 years later. Basically you do a detailed estimate of discounted cash flow for X years then after X you know your estimates are getting more and more difficult to justify so you sum up everything in one number and you use an estimated capitalization rate to determine this final number. It is estimates on top of estimates, being able to justify them standing in front of an audience is important.
Percentage of Market Captured is very much key to the classic VC method of valuation. After I made this spreadsheet I made two more which allow for no income for a period of months and allow for market size to change over time. The VC method is relatively quick and dirty, again you’re taking a complicated business proposal and trying to assign it a single numerical value.
VC’s always need an exit. So in X years they figure they can get an exit, in the Xth year they figure the company will have so much of the market and they estimate the market will be so big. They also have to estimate operating costs based on the business plan / pitch deck. This number is called “Terminal Net Income” and it is on the worksheet labeled “WorkArea”. Once you have the Terminal Net Income you can calculate the Terminal Value which is Terminal Net Income over a comparable P/E, sometimes a publicly traded company’s P/E is used, sometimes it is difficult to get the an accurate P/E ratio for a company that doesn’t yet exist in a market that hasn’t been proven.
Once you have the Terminal Value you discount it back X years using the desired IRR which is often a large number as VCs need home runs, you can earn 3 to 10% more safely in the public stocks and bonds market, venture capital is generally considered a riskier investment so investors demand a higher return than they can get in bonds and stocks.
It is possible after the exit the company will go on to be an even bigger success like YouTube or it is possible after the exit the company will lose market share like MySpace. In both cases the VCs and founders and other early investors profited handsomely. YouTube was started and sold to Google without ever generating much cashflow. It went from being a few person operation above a pizzeria to being one of the most visited websites on the Internet and the defacto standard for sharing short 1-5 minute video clips online. With Google’s search and ad network they could monetize it, as an independent entity it burned through a lot of cash paying for all the bandwidth.
Obviously VCs and founders would like to see their companies become lasting successes, but after the successful exit, the VC is less involved and moves on to their next investment. Timing the sale (exit) is very important in venture capital.
I hope this answers your questions.
i tried to open the file, but it only show the cashflow statement page… which excel version do i need to open it
It downloads and opens fine. It is a .xlsx file so you need a version of Microsoft Excel created in the last 7 years. To switch tabs just click on the tabs at the bottom.
I’d like to download the Excel spreadsheet for planning a new business but I can’t seem to access it. when I click on the link that indicates download spreadsheet now it looks like the spreadsheet is corrupted
It downloads fine. I just tried it. The spreadsheet is most definitely not corrupted. It gets downloaded successfully almost every day. It is a .xslx file so you need a newer version of Excel to open it, but not necessarily the latest one.
Thank you! I’m a newbie entrepreneur, and this is just what I need… Thank you thank you thank you!!!!
Good luck! It takes more than a spreadsheet to start a business. Let me know when you’re closer to opening.
Well done mate! Stay positive – you can do it!