Google Analytics E-Commerce Dashboard
August 18th, 2013
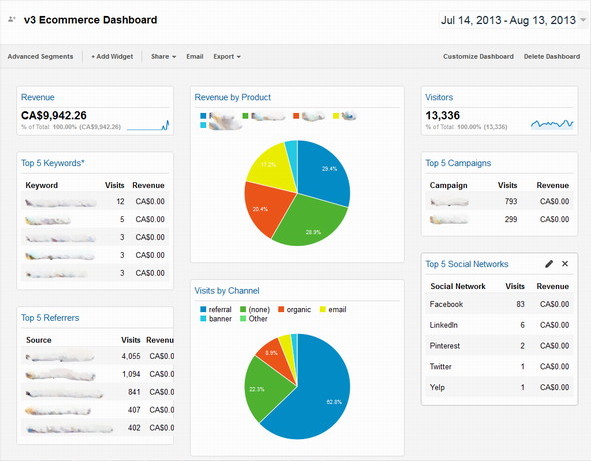
Although you should definitely take advantage of Google Analytic’s five custom variables and custom reports, there is something to be said for a standardized high level dashboard. I kept refining one, taking bits from here and ideas from there. Now I think I got all the data that will fit above the fold and decided it was ready to share with the world.
This dashboard shows the following information:
- Total Revenue
- Revenue by Product
- Number of Visitors
- Visits by Channel
- Top 5 Keywords*
- Top 5 Campaigns
- Top 5 Referrers
- Top 5 Social Networks
Top 5 Keywords has an asterisks beside it as you need to modify the custom filter to remove branded keyword referrals. I don’t know who invented this technique, but it has become pretty standard in Google Analytics land. Here is a slightly edited screenshot of how the dashboard looks:

A lot has changed in Google Analytics since 2013. One big change is they have an iPhone app. They keep the keyword referral data now so you need to use Google Search Console to get aggregated data. I’ve been working extensively on this blog especially old blog posts such as this one to try and make them more useful. I’ve used Google Analytics since it was Urchin but I’m not certified and I’ve rested on my laurels a lot the last few years as I’ve focussed on passing all the CFA® exams but if you have any thoughts or questions you can leave them below.
This entry was originaly posted on , it was last edited on and is filed under: Technology and tagged: Analytics, Dashboard, Google Analytics.


One CommentLeave A Comment Now