Tableau Your Data: A Book Review
April 22nd, 2019
As part of my ongoing job search I have seen a lot of job postings listing Tableau as a requirement or a nice to have. And in a recently purchased Humble Bundle of ebooks was “Tableau Your Data!” 2nd edition so I’ve finally taken the plunge to increase my data visualization skills.
Tableau was first released in 2003. It is software that makes it easier for non-programmers to turn tabular data into impressive visuals. More importantly it is a relatively easy and quick process. Your data can be in an Excel spreadsheet, a CSV file, a database, an API, even a PDF. The software has the capability to do some data munging but works best with well formatted data, so all my years of using Excel, SQL, and my recent studies of Python can still be leveraged.
Like Excel But…
Microsoft Excel was released in 1984 as one of the original Mac apps. I’ve used it almost that long and spent a lot of time after my MBA learning all sorts of tips and tricks including VBA. Alas many people do not understand how Excel works, people even call it a database, they don’t lay out their tables logically, they don’t use ranges or formulas, they just muddle through. Tableau uses some of the same terminology as Excel but must look friendlier, more like a graphical editing program and less like math.
You can Publish to the Web
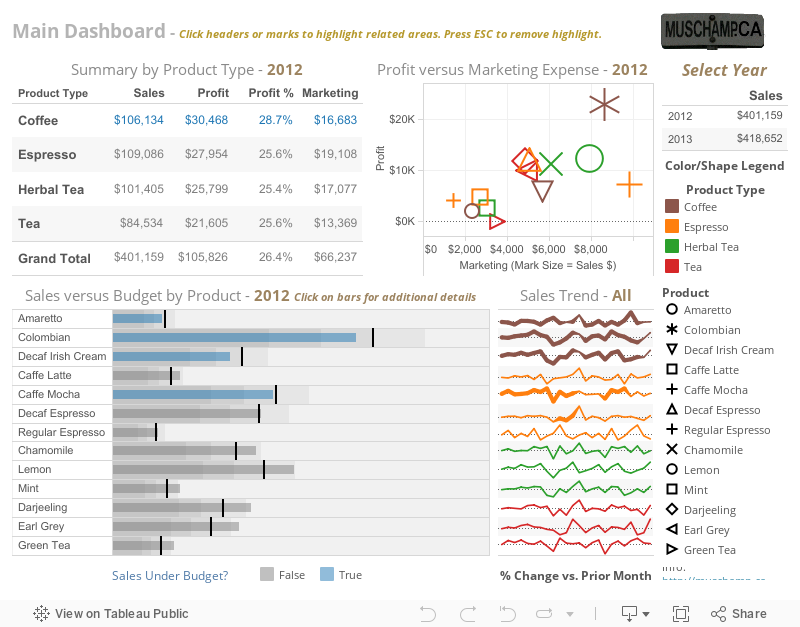
Not only can Tableau make a pie graph or a line graph just like Excel or Python it is only a couple clicks to publish your visualization to the web. This quick and easy sharing, including embedding on blogs (see below), or on Twitter or Facebook is probably one of its killer features. Excel graphs should adjust when you change the underlying data, but Tableau’s visualization can be even more interactive. Along with speed and ease of use these are probably Tableau’s killer features.
Learn how from Instructional Videos
When I was studying for the CFA® Program I eventually had to switch to eBooks and that is the reason I finally got an iPad, but many Candidates preferred to learn by instructional videos on YouTube or through a third party provider. People even watch the videos sped up. Early in his book Dan Murray recommends watching the official instructional videos Tableau has provided.
So How Much Does Tableau Cost?
The answer probably is “It depends.” But there is good news, you can try the Desktop edition for free. You can also use Tableau Public for free. Tableau puts some limits on what you can do for “free” but you can still do a lot. Tableau Public is sufficient to follow the instructional videos but not everything in the first ten chapters of this book.
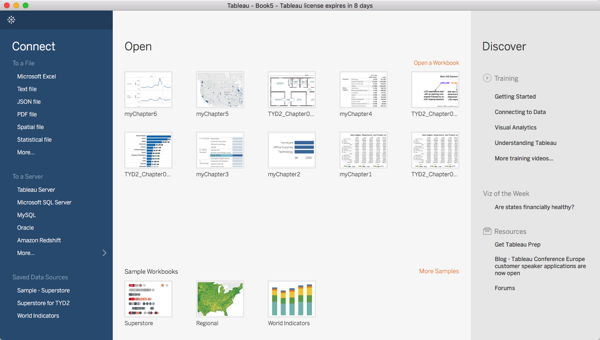
You can Download the Free Trial
After signing up for Tableau Public and downloading the Tableau Packaged Workbook files (.twbx) from the book’s website I was repeatedly unable to open these files as they were not already on Tableau Public. So I and you should download the 14-day free trial of Tableau Desktop. The version I download is newer than the version used for the book so some screenshots will not be identical, but you can open the workbooks downloaded from the book’s website.
And Follow Along
I had the eBook on my iPad and then ran Tableau Desktop on my laptop. Often there were pictures with insufficient explanation on how to create the “pill” or “worksheet” or “LOD expression”. In this case you need to either wait a few more pages or even chapters or you can try to figure it out by opening the Tableau Packaged Workbook files provided by the author which is why you can not follow along with just Tableau Public.
What about on a Mac?
I use a Mac, which is well passed it’s prime, and the author seems to have taken most of his screenshots on a Mac. Sometimes he explains what is different between the Windows version and the Mac version and sometimes he does not. The biggest exception is a technique he refers to as “Right Mouse Button Drag”. I totally recommend using a mouse with two buttons and a scroll wheel even on a Mac, but you can not right mouse button drag or at least I couldn’t. Through trial and error I learned you need to “Option Click and Drag” the Dimension or Measure pill to a shelf.
What’s all this jargon mean?
Tableau has a lot of jargon, you definitely need to learn the following terms:
- Dimension: data that is typically text, dates, or key-value pairs
- Measure: numeric data that you can use math on
- Datasource: any source of data which Tableau can access
- Pill: the icon representing an entity that you click or drag to a shelf
- Shelf: a container where pills are placed to create visualizations in Tableau
- Parameter: formula variables that act as quick-filter-like controls
- Calculated Field: new measure or dimension created by defining a formula within Tableau
- Group: an ad hoc entity, a set or combination of data
- Bin: used in histograms and some other visualizations
The book actually has a full glossary which I never looked at until I finally decided to write down some of the Tableau specific terminology you must grok in order to follow along. Bin didn’t make the glossary but did make the official Tableau online help repository, Google is your friend.
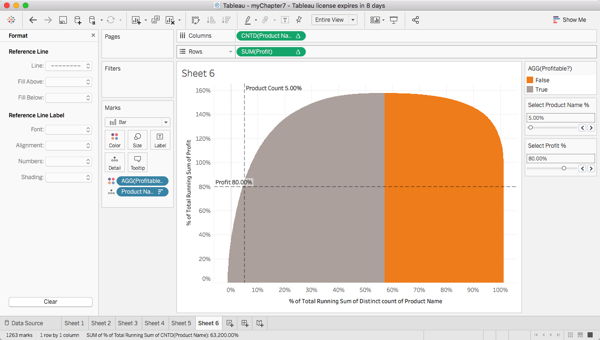
What’s a Table Calculation?
These are similar to Excel formulas they allow you to add new data to your Tableau workbook. They are also similar to Calculated Fields in Tableau but you must understand Table (Across) versus Table (Down). Sometimes the solution is to switch from one to the other. You can also convert a Table Calculation into a Calculated Field which basically allows you to use it on other worksheets.
More Tableau Resources
In Part 1 of the book you learn to build worksheets, dashboards, even stories. Part 2 of the book deals with Tableau Server and is likely of less interest to the average reader. Tableau Public is a free public version of Tableau Server and where I published the dashboard above. If you want to learn more Tableau techniques, tips, and tricks you can try one of the links below:
- Andy Kriebel’s Tableau Tips
- Interworks’ Tableau Tips
- Analytics Vidhya’s Guide to becoming a Tableau Expert
- 7 tips and tricks from dashboard experts
- Official Tableau Software YouTube Channel
That’s about all I have to say about Tableau for now. With only a few clicks you can put together some slick visualizations but making the inline dashboard above takes considerably longer. The author sometimes explains things clearly, sometimes you’re going to have to rely on some trial and error, or even Google to duplicate his screenshot. I’m probably going to build another dashboard, but first I’m going to publish this blog post to see if anyone has any tips or techniques they want to share on using Tableau.
This entry was originaly posted on , it was last edited on and is filed under: Reviews and tagged: Book Review, Data Analysis, Tableau.