
Python for Financial Analysis
June 4th, 2019
During my lengthy job search after passing the third and final CFA® exam I began learning Python. At some point I got an ad on Instagram for a course on Udemy and since I’d never taken one and was trying to combine my background in information technology with my post-graduate studies of finance I eventually registered. Below are my thoughts on taking the course.
The full title of the course turned out to be “Python for Financial Analysis and Algorithmic Trading”. It starts with a review of basic Python language features. Then it covers NumPy and pandas which were covered extensively in my study of Python for Data Analysis. Eventually the course gets into language features and libraries more specific to financial analysis.
Your Instructor: Jose Portilla
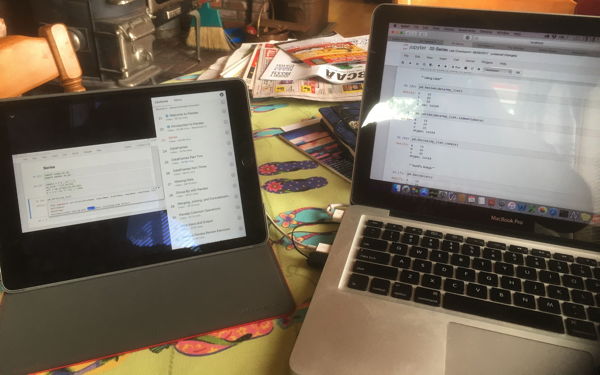
Jose provides 17 hours of video clips which you can watch on your laptop online or you can install an app and watch them through that. I opted for the two screen solution of using the app on my iPad and then typing on my MacBook Pro. So yes you can take the course using Apple devices, but you can also use Python on Linux or Windows. Jose provides instructions on setting up the environment he prefers which is the Anaconda distribution and then typing code into a Jupyter Notebook. This is pretty much identical to how Wes McKinney teaches Python in his book.
Advantages of Online Lessons
I honestly think I prefer books but the reason why online lessons have become popular especially among Generation Y and Z is they are used to being online all the time. Employers probably like them for training as you can verify that someone sat through the video and you can insert quizzes at various points in the course to ensure at least minimal comprehension. In the olden days when you completed a book you could proudly display it on a shelf, nowadays when you complete an online course you often get a badge. With this course on Udemy I earned a certificate I can share on social media.
Although I provided a link to the course above, I noticed I got a different price depending on whether I clicked on the ad in Instagram versus searching for the course name in Google, so shop around.
NumPy
NumPy is short for Numeric Python. It is the foundation of both data analysis and financial analysis using Python and is built upon and expanded by other libraries. The key feature is an array class. This is considered superior to Python’s built in list datatype. Once you have your numerical data in a NumPy array you can then use a wide variety of formulas on all the numbers from simple summation to taking the sine of all the numbers. You can also use NumPy to generate random numbers for testing purposes.
pandas
This builds on top of NumPy and adds two more data types: Series and Data Frame. Series is a one-dimensional array with axis labels. It is perfect for Time Series which are extremely common in financial analysis. Data Frames are two-dimensional and perfect for tabular data similar to what you would find in a database or an Excel file. All this can be considered “panel data” which is where the name pandas comes from. Here is a quick introduction to pandas.
Data Visualization
Another focus of my post-CFA studies has been data visualization. Wes’s book focussed on this extensively but I also studied Tableau for data visualization. Unlike Python which requires typing code, Tableau is a drag and drop solution. You can of course continue using Microsoft Excel but as I said in a job interview recently, it is no longer 1984. In both Wes’s book and Jose’s online class the main data visualization tool is matplotlib. Jose recommends this tutorial. Other libraries build upon matplotlib including pandas own visualization but another option used in Wes’s book is seaborn which is extra spiffy.
Sourcing Data
I’ve actually done a lot of work with APIs and I’m well aware they change or disappear so I was not surprised to learn that although the course covers reading data from APIs it acknowledges that sometimes it does not work. The two tools covered are pandas datareader and Quandl. The latter is for-profit venture that provides tools for accessing financial data in Python. You can access a certain amount of data for free, more than enough to complete the online course. You can signup for an API key to get more free data.
Time Series
Time series were one of my many nemesis during the CFA Program, but a lot of financial data including stock prices come in the form of a time series. As someone who has programmed for a long time I’m well aware of the difficulties in comparing dates and times. Computer systems often count forward from a point in time, this is how Unix does it. Where this becomes a problem is dates and times in the past and eventually it will become a problem for dates and times in the future. Besides off by one errors, errors involving dates and times are very common in programming and much code gets written to handle edge cases and things like leap years.
Capstone Stock Analysis Project
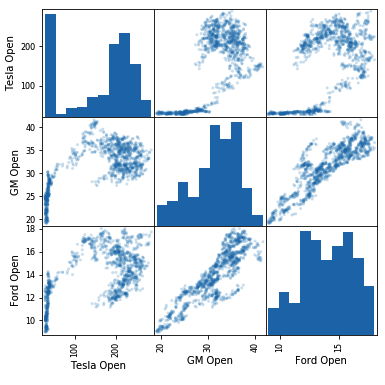
Now that you know the basics of Python, NumPy, pandas, and matplotlib you are encouraged to do an analysis and comparison of some stocks. This is the most difficult portion of the course up until now. As part of the capstone project you create a scatter matrix plot show below. I’m not sure how useful this is when evaluating three stocks, but it looks impressive. This course is about two years old now and there have been some slight changes in libraries since the videos were made so you will need to adapt to using methods like idxmax().
Time Series Alphabet Soup
After completing the stock analysis capstone project you learn more about time series and algorithms related to analyzing time series data. You also learn a bit of the Python library statsmodels which was also covered in Wes’s book. The following models are covered: ETS, EWMA, and ARIMA. Other terms you will peripherally learn about include the Hodrick-Prescott filter, autoregressive, stationarity, the Dickey-Fuller test, and autocorrelation. Some of this material is in the CFA Program Curriculum.
Finance Fundamentals
Approximately seventy-seven videos into the course it switches from covering programming and statistics to focussing more on finance. The topics Jose chose to focus on are Markowitz portfolio theory, the Sharpe Ratio, the efficient frontier and the Capital Asset Pricing Model. These are all covered extensively in the CFA program and I have made many notes on these topics over the years some of which I liked to above. There are of course code along tasks to go with exploring these concepts in Python.
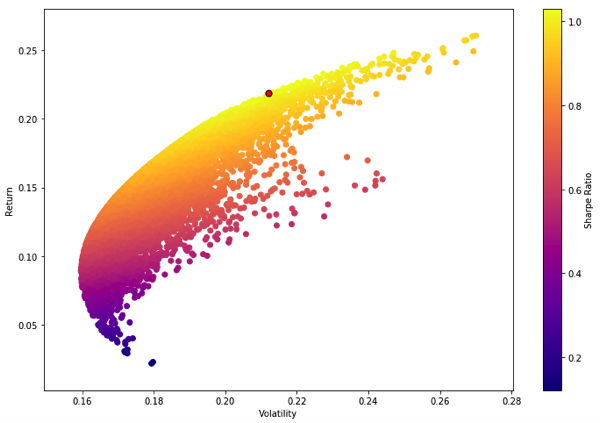
Portfolio Optimization
The course teaches two ways to optimize a portfolio. One uses a Monte Carlo Simulation which is basically a random number of guesses and then you keep the best guess and call it optimal. The second solution involves more math and another Python library called SciPy. If you’ve been reading along and wondered why someone shouldn’t just do all this in Microsoft Excel well there are several reasons:
- Python is free, as are all these libraries, Microsoft Office is not.
- Dataset size: I’ve worked on some very large Excel spreadsheets, Python with pandas allows you to deal with large datasets quickly and easily.
- Speed: Importing data, writing the Excel formulas, dragging down and across for thousands of cells takes time. Python can calculate for example your average daily portfolio return quickly with minimal keystrokes.
- Fancy Plots: making a pie graph or bar graph in Excel is not hard, but often requires some manual adjusting, making something like the scatter matrixes shown above and below would be non-trivial in Excel.
- More options: with NumPy, statsmodels, and SciPy you have a lot more options and algorithms you can use rather than just least squares linear regression.
Algorithmic Trading
This is another topic that was recently added to the CFA curriculum, but during the three six-hour CFA exams you don’t have to write any algorithms. The CFA curriculum changes every year and soon at least Level 1 will be done on a computer so who knows algorithmic trading could become a larger focus in the future. The platform used in Jose’s course is called Quantopian. You need to sign up in order to follow along, but much of their code is open source and in GitHub if you’re particularly paranoid or curious. Quantopian has changed since the course was created so you just have to follow along as best you can. This is the longest and most complicated section of the course.
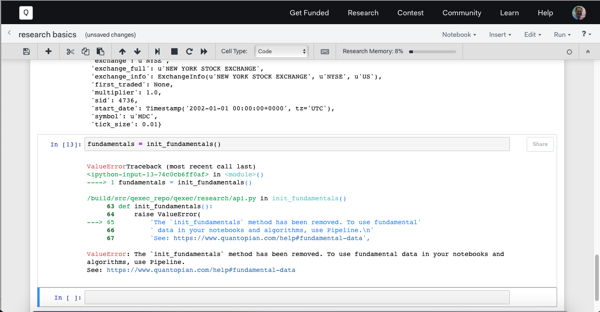
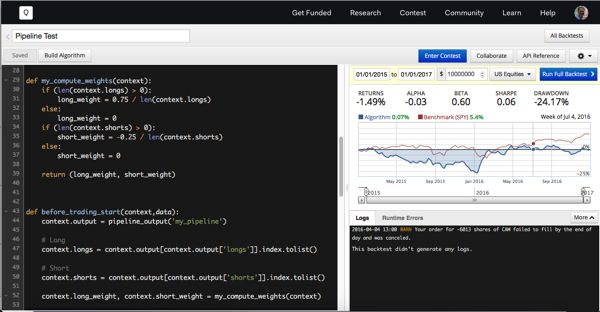
Trading Algorithms in Quantopian
Using Quantopian to backtest trading algorithms is one of the last major topics introduced. You can also use Quantopian to conduct research into individual stocks, portfolios of assets include futures, and even to analyze economic fundamentals. Another Python library is introduced, this one is called PyFolio. It was created and open sourced as well by the Quantopian team. It creates plots, charts, and calculate ratios useful for analyzing portfolio performance. Other topics that Jose touches upon include using leverage and hedging.
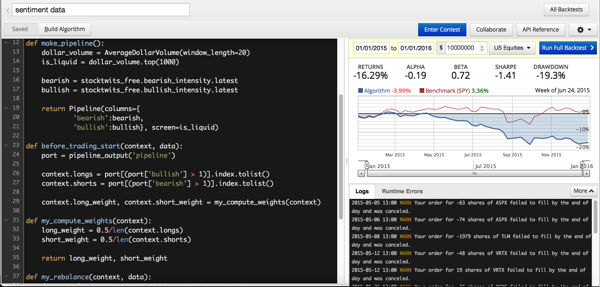
Sentiment Analysis
As if plotting all sorts of ratios and spreads using matplotlib, pandas, and PyFolio wasn’t enough. The course also briefly covers using Quantopian to leverage sentiment analysis based on natural language processing as part of analyzing a stock or constructing a trading algorithm. This sort of data is “never free” to quote Jose, but there is some limited free data you can explore. And of course while I was coding along it seems the Accern Alphaone sentiment data used in Jose’s example is not longer on Quantopian. Quantopian has other data sources. I switched to using the bullish and bearish signals from Twitter. If you’re surprised that random people tweeting do not always know what they’re talking about I suggest you follow me on Twitter. I’m sure my algorithm which I hacked together in a few minutes could be improved as it lost over 16% in a single year the very first time I backtested it. Looking more closely in the time period of calendar 2015 the S&P 500 was barely positive so perhaps it would perform better in another time period, beware data-mining bias. There is also a missing negative sign, can you spot where it should be?
More Python Programming
Having now completed this course I’m not sure how much more Python programming is in my future. I still have PHP and JavaScript I want to update or completely replace, but I’m also interested in further improving my resume and LinkedIn profile. So I’m definitely claiming credit for completing the course. The fact I fixed the sentiment analysis trading algorithm is proof I made it through all the material surely? Sometimes the videos don’t play immediately and Udemy seems to think I have not watched every video though I assure you I did. I got asked to update my review so I think there may just be some lag. I can manually click off the videos on the website, the app seems to think I am 99% done. Eventually I earned a certificate of completion.
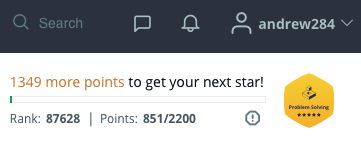
In addition to Quantopian’s contest there are other contests, challenges, and tests you can potentially undertake. Although I coded up a number of Quantopian trading algorithms during the course, none were eligible for their weekly contest. I might try to code up something that meets all the constraints someday. I also had to take a test on HackerRank as part of my job search and I did my share of practice problems. I eventually did enough to earn a gold badge. One complaint I’ve heard about HackerRank and Python is you can not use NumPy or pandas, so if you want practice using those particularly libraries you’ll need another option besides HackerRank.
Is this course for me?
I don’t know. I had both experience programming in Python and experience in conducting financial analysis prior to taking the course so I cruised through it pretty easily. That said the course comes with a crash course in Python if you are new to the language. Jose and Udemy will gladly sell you another course and I have previously linked to and blogged about free online resources to learn Python. If you are specifically interested in algorithmic trading using Quantopian they have 56 online lectures currently and there are competitors to Quantopian that support other programming languages besides Python.
More Python for Finance
Python for Finance is a book by Yves Hilpisch. It is subtitled “Mastering Data Driven Finance” which would make a good blog post title if I had more time and energy. I just finished reading Yves’s book and I may even write a short review on GoodReads but first I thought I would update this blog post. This book is long. It has a lot of math and spends a lot of time on futures and especially options which isn’t too relevant to what I do in my day job. I think Python for Data Analysis or one of the many online resources for Python is a better place to start. But if you would like to read 600 plus pages of programming, math and algorithms for valuing options, this could be the book for you. And if it isn’t Yves has written even more books and he too will sell you a course.
If you have thoughts on Python or Finance or Udemy or books you can leave them below. With lots and lots of effort I seem to have made this blog less popular.
This entry was originaly posted on , it was last edited on and is filed under: Personal Improvement and tagged: Data Analysis, Finance, Python.